
Build a report from your data
Shape the exact view you need and save it to reuse.
3 min read Real product screens
A report in Knowella is just a saved question about your live data. Pick the fields, filter to what you care about, group it the way you think about it, and it re-runs on current records every time you open it.
app.knowella.com
1
Pick fields, filters & grouping
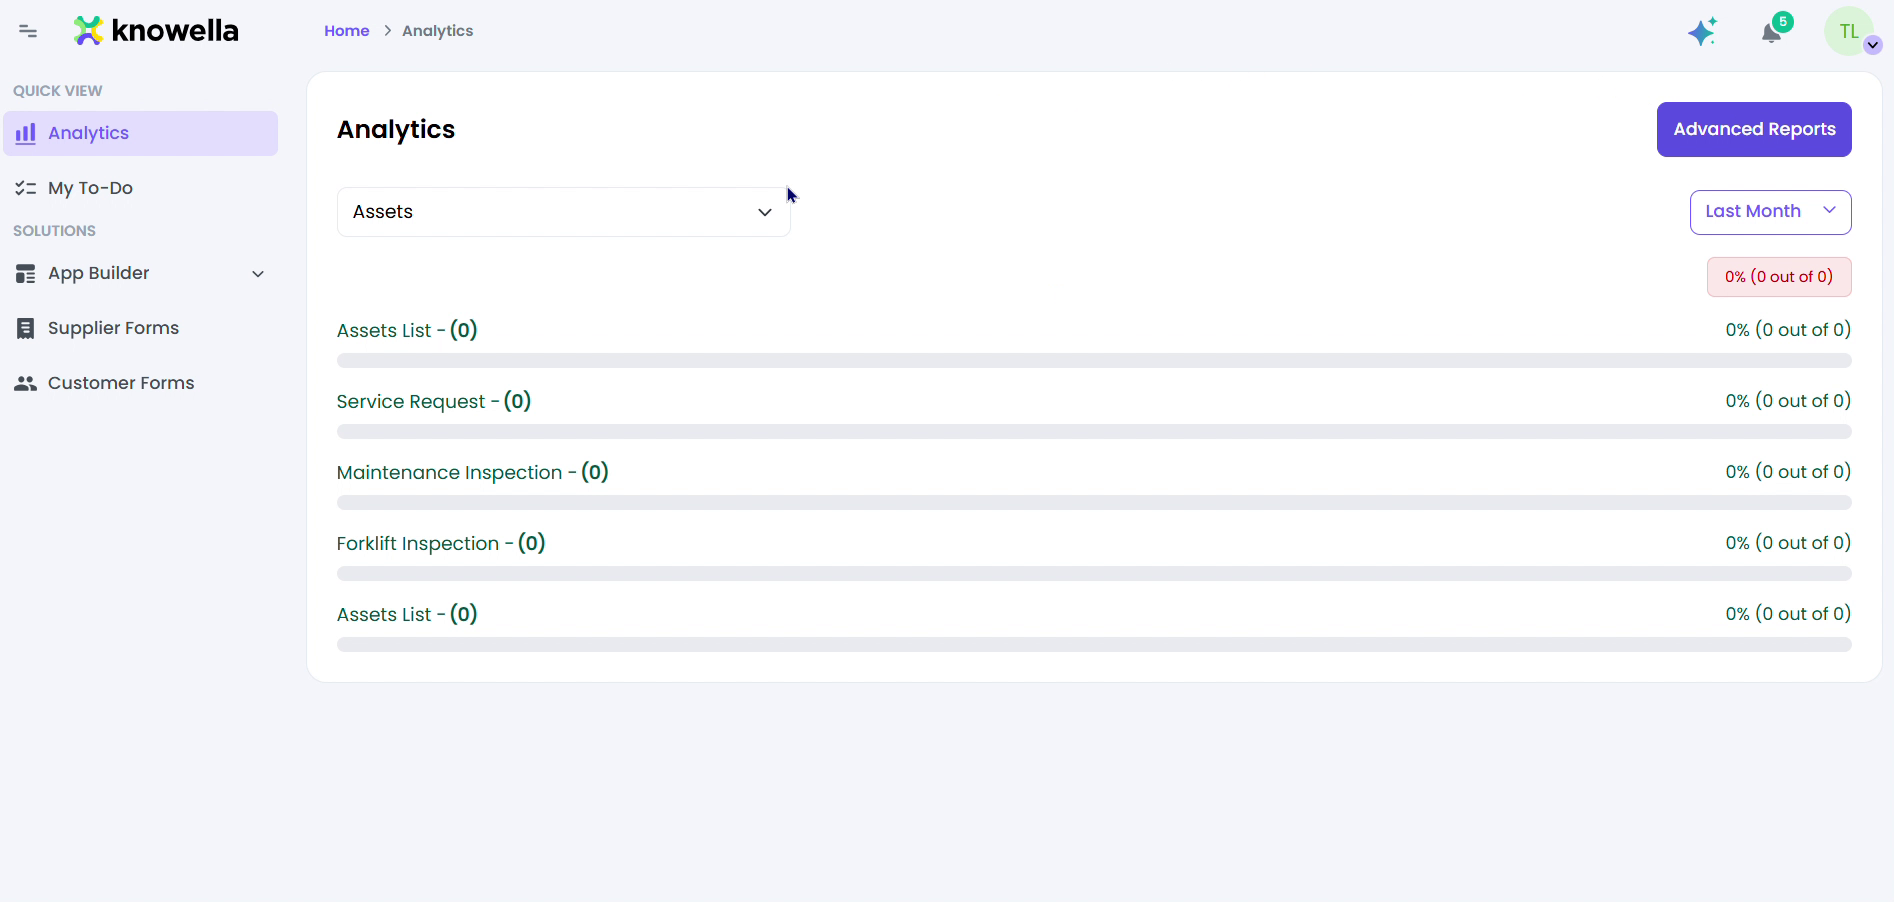
The screen here is the Analytics report builder. You choose the app and the fields to include, apply filters to scope the data — by site, date, status, or owner — and group by any dimension to summarize it. Because it reads live submissions, the report you build isn't a one-time snapshot: save it and it re-runs on current data every time you open it.
- Fields — Choose exactly which data columns appear.
- Filters — Scope by site, date, status, or owner.
- Group & summarize — Totals, counts, and averages by any field.
2
Why it matters
The reports that actually get used are the ones that are always current and open in a single click. Because Knowella reports read straight from live submissions, you never rebuild them — you build the view once and it stays true.
Ready to build your own?
Start free and ship your first app in minutes — or have us set it up with you.
More resources